

Power BI vs Tableau is one of the top trending comparisons for business intelligence, and there’s no surprise in that. When it comes to visualization depth, Tableau has the upper hand, while Power BI has the upper hand in terms of cross-platform versatility and being an affordable solution, and integrates better with Microsoft 365. After 18 years, Microsoft continues to dominate the Gartner Magic Quadrant for Analytics and Business Intelligence Platforms — and that’s a clear indicator of why companies must invest in the right analytics and BI tools for them. If you’re looking at the business intelligence software 2026 has to offer, you can compare data visualization tools or just figure out which is the best business intelligence tool for your small business or enterprise.
What Is Power BI and What Is Tableau?
To dive deeper into the Power BI vs Tableau debate, we first need to know a bit about what they do and why the Power BI vs Tableau for business conversation is so prevalent in boardrooms and data teams.
Power BI is Microsoft’s business intelligence suite, which transforms raw data into data-rich interactive dashboards and reports. It is a native option, and it integrates with Excel, Azure, Teams and the full Microsoft Fabric environment, making it a default option for organisations already on Microsoft 365. When it comes to data visualization tools comparison, Power BI always has a great advantage as it integrates seamlessly with Microsoft.
Tableau, now owned by Salesforce, is a visualization-first analytics platform built for analysts who want to explore data deeply, create sophisticated visuals, and pull from a wide range of sources beyond any single vendor’s ecosystem. In any honest data visualization tools comparison, Tableau’s visual depth and cross-platform flexibility consistently rank it among the best BI tools available today.
Both have been named Leaders in the Gartner Magic Quadrant, and both are key names in any business intelligence software 2026 evaluation. But they solve the same problem in noticeably different ways.
Why Does Power BI vs Tableau Matter for Business Intelligence Software 2026?
The BI landscape has shifted dramatically. Business intelligence software 2026 isn’t just about dashboards anymore — it’s about how fast a tool moves you from raw data to a real decision. Microsoft folded Power BI into Fabric, its unified data platform, while Salesforce rebuilt Tableau around Tableau Next, a metadata-first layer connecting directly to Data Cloud. Both companies are embedding AI agents into everyday reporting workflows, which changes what a “right fit” BI tool even means this year.
For any organization working through a serious data visualization tools comparison, the choice between Power BI vs Tableau now carries real long-term implications for AI readiness, total cost of ownership, and team productivity. If you’re evaluating business intelligence software 2026 options with an eye on scalability, Power BI vs Tableau for business should be at the top of your shortlist.
How Do Power BI and Tableau Compare on Pricing?
Cost is where the Power BI vs Tableau conversation usually starts, and the numbers aren’t close.
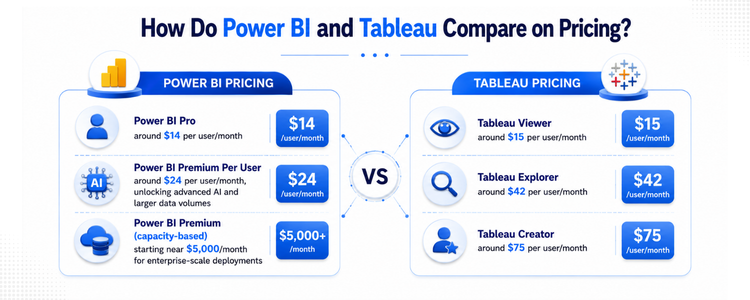
- Power BI Pro: around $14 per user/month
- Power BI Premium Per User: around $24 per user/month, unlocking advanced AI and larger data volumes
- Power BI Premium (capacity-based): starting near $5,000/month for enterprise-scale deployments
- Tableau Viewer: around $15 per user/month
- Tableau Explorer: around $42 per user/month
- Tableau Creator: around $75 per user/month
On a straight license basis, Power BI is significantly cheaper, especially for teams already paying for Microsoft 365. But total cost of ownership tells a fuller story. Power BI’s price advantage narrows at enterprise scale once Premium capacity and Fabric licensing enter the picture, while Tableau’s Creator-tier pricing gets expensive quickly as more people across the business need authoring access rather than just viewing rights.
For anyone hunting for the best BI tool for small business on a budget, Power BI’s entry pricing is hard to ignore. But for growing teams with complex visualization needs, understanding total cost — not just license cost — is what separates a smart decision from an expensive mistake.
Which One Wins on Data Visualization and Ease of Use?
But that’s when Power BI vs Tableau for business really gets interesting, not because of the power, but because of the user and the usage.
Tableau is always a standout performer in terms of visual elegance and versatility when it comes to data visualization tools. It has a forgiving drag-and-drop interface for newbies, the syntax for created fields is hierarchical and includes terms that are comparable to the ones used in natural Excel logic, and analysts like it for its performance with sophisticated, multi-source data.
While it’s a bit more complicated to get into at the beginning, Power BI really grows on you once you start getting into DAX. Teams with solid experience in Excel are typically up to speed in a couple of weeks, and even non-technical users can become very comfortable in Tableau in 4-6 weeks.
Quick Breakdown:
- Visualization depth: Tableau edges ahead
- Learning curve for Excel users: Power BI feels more familiar
- Governed dashboards at scale: Both are strong, with different tradeoffs
- Multi-cloud, multi-source environments: Tableau performs more consistently
What’s the Best BI Tool for Small Business?
Finding the best BI tool for small business comes down to what your team already uses daily and what you can realistically afford to implement well.
Power BI makes sense if:
- You’re already running Microsoft 365, Excel, or Azure
- Budget is a real constraint, and you need the best BI tool for small business that delivers without a heavy upfront investment
- You want a shorter ramp-up for Excel-literate staff
Tableau makes sense if:
- Your team needs polished, presentation-ready visuals for client-facing reporting
- You pull data from varied sources beyond the Microsoft ecosystem
- You have, or plan to hire, a dedicated analyst who lives in the tool daily
For small teams doing a Power BI vs Tableau for business evaluation for the first time, the deciding factor is almost always daily workflow fit, not feature checklists. Most small businesses start with Power BI for cost reasons, but visualization-heavy industries like retail merchandising, marketing analytics, and client-facing reporting often find Tableau’s output quality worth the premium.
How Do Power BI and Tableau Handle AI in 2026?
AI is no longer a luxury feature in any business intelligence software 2026 analysis — it’s the current battle cry and a core element of any meaningful Power BI vs Tableau assessment this year.
The new Copilot in Power BI can now handle up to 10,000 characters of natural language for complex multi-step queries, write and debug DAX formulas, and create full report layouts from simple text prompts. If teams are already leveraging AI development with Microsoft in their ecosystem, the assimilation of Copilot into Power BI becomes a natural next step.
Tableau has gone the other route with Tableau Agent and Tableau Pulse, embracing proactive, conversational analytics with Salesforce’s Agentforce approach. Instead of having to go to a dashboard, Pulse delivers metric updates straight to Slack. Tableau Agent proposes its own new calculations. If your organization is already subscribed to data analytics services and AI Workflow Automation, then Tableau’s proactive insight delivery process resonates with your customer’s data team.
Both methods are equally good; neither is objectively superior. Tableau’s AI is not integrated into the report creation itself, but it’s built to proactively bring insights that would otherwise lie dormant to light.
Which Should You Choose in the Power BI vs Tableau Debate?
The answer to the Power BI vs Tableau question is never as easy as you would think, and any comparison that doesn’t acknowledge that is simply wrong. The correct answer will depend on your business and your team’s expertise, as well as the way your business uses data.
If you are a Microsoft-centric organization and cost efficiency is a factor, and you want to deploy Power BI fast and in a wide cross-section of teams, then Power BI is the correct product to choose.
Use Tableau when visual storytelling is key to presenting insights, your data is spread across sources other than Microsoft, or you’re familiar with the Salesforce ecosystem.
As companies grow, they often find that they need both Power BI for reporting and Tableau for deep-dive analysis-driven exploration. When it comes to Power BI vs Tableau, the answer is no; there’s no bad tool for making business decisions—there’s only a tool without any idea of where it belongs in your actual data stack or in your team’s capability.
Where AI Development Services and Data Analytics Services Fit In
Power BI vs Tableau is only half the equation. The bigger opportunity in 2026 is what you build around whichever platform you choose. This is exactly where AI development services and data analytics services make the real difference — connecting your BI tool to automated pipelines, predictive models, and AI Workflow Automation that transforms static dashboards into systems that act on your data rather than just display it.
Whether you’re architecting a governed semantic layer, deploying AI Workflow Automation across reporting cycles, or layering machine learning on top of existing dashboards, the platform is your starting point. The value of AI development services and data analytics services comes from what sits on top of it — the intelligence layer that turns visualization into real business outcomes.
How Do You Decide Between Power BI and Tableau for the Long Term?
When deciding between Power BI and Tableau, it is important to remember that it is a multi-year commitment. Prior to committing, draw up a map of three things: what tools and technologies you are using today, what skills your team already possesses, and the nature of your data needs over the next couple of years. For a small business that is growing quickly, the ideal BI tool for small businesses may become too small in only 1.5 years, while for a large enterprise already entrenched in Salesforce, the ideal BI tool for small businesses’ ecosystem may prove to be the better option despite the higher cost of the license.
Do a pilot on both systems, using real business data, before rolling out to the entire company. A marketing demo doesn’t always tell you what a tool will be like when you actually start reporting on your complexity, and a trial only lasts for 2 weeks, which can save you months of rework. If your internal bandwidth is restricted, your rollout can take a quantum leap in time-to-value when you combine it with a professional data analytics service, either platform.
What Governance and Security Differences Matter in Power BI vs Tableau?
Governance is often the deciding factor once a Power BI vs Tableau for business evaluation moves past the pilot stage. Power BI’s row-level security and deployment pipelines are strong out of the box, but advanced governance features typically require Premium or Premium Per User licensing. Tableau’s Catalog and lineage tools offer similar visibility into data flow and access control, but they usually sit behind a separate Data Management add-on that adds to total cost.
Power BI’s governance model benefits from deep integration with Microsoft’s existing security infrastructure — admins already managing Azure Active Directory find the setup minimal. Tableau’s governance experience gives administrators granular control but often means a steeper process for teams without prior Tableau experience.
How Do Power BI and Tableau Perform on Large, Complex Datasets?
Performance at scale is another area where the Power BI vs Tableau comparison gets technically significant. Tableau’s VizQL engine and in-memory caching, paired with Hyper for query acceleration, handle large, multi-source datasets efficiently — one reason it stays popular among organizations on Snowflake, Databricks, or on-premises SQL Server. Power BI performs best when data lives inside the Microsoft ecosystem, particularly with Direct Lake mode inside Fabric, built to query large datasets without the traditional import-and-refresh cycle.
If your organization manages genuinely massive, cross-platform datasets, a proof-of-concept on real data volumes beats any vendor benchmark. For teams without the internal expertise to run that evaluation, engaging specialized data analytics services or AI development services early in the process can prevent a very expensive wrong turn.
Final Thoughts
The question of Power BI vs Tableau is not which is “the better tool,” but which one is “the better tool for you?” Power BI is strong on the cost side and on being integrated with Microsoft, while Tableau is better at in-depth visualization and flexibility across sources. Whether you are still in the process of making the decision or you are looking to take your data beyond dashboards and into the realm of AI-powered automation, predictive analytics, and intelligent data workflows, AnavClouds Analytics.ai can help you create a data strategy that grows with your business, rather than a report that impresses in a meeting.
Frequently Asked Questions
Is Power BI or Tableau better for beginners?
The formula logic is similar in Power BI, and it’s less expensive, so Power BI is more user-friendly for beginners who are comfortable using Excel. Tableau’s drag-and-drop interface is also simple to use, though more advanced aspects may require more learning.
Which is cheaper, Power BI or Tableau?
Power BI is less expensive on a per-user basis, the cost of which is expected to be around $14 per month, compared with Tableau, which charges for full authoring access at $70–$75 per month. The total cost depends on the size and enterprise features.
Can Power BI and Tableau be used together?
Yes, many companies have both Power BI and Tableau in use – Power BI for operational reporting, and Tableau for in-depth, analyst-driven visual exploration of multiple data sources.
Which tool is better for large enterprises?
Scale at the enterprise level. In fact, Power BI is a better fit for Microsoft-centric companies, while Tableau excels in multi-cloud setups that require more visualization and cross-platform data access.